In the three-dimensional finite element analysis of surrounding rock stability of underground powerhouse of Suofengying Hydropower Station in Guizhou Province, the preprocessing function of FEPG is used to complete the modeling of underground powerhouse and stratum distribution, and the combined grid method is used for grid generation< br />
{[ 10]}
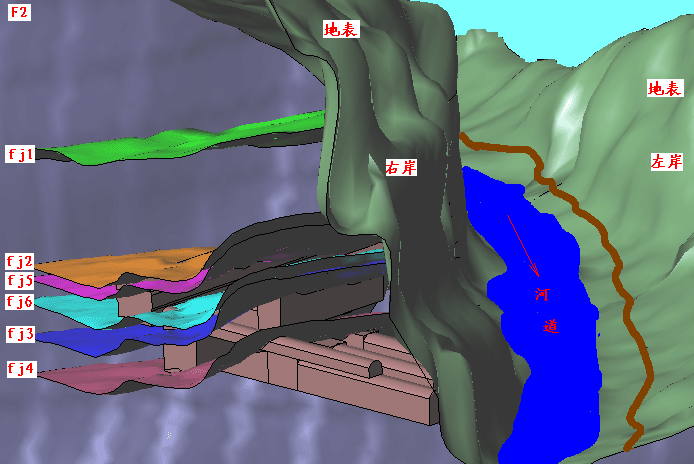
& nbsp; & nbsp;& nbsp; & nbsp; Calculation scope, stratum, riverbed and powerhouse area location map & nbsp& nbsp; & nbsp; & nbsp; & nbsp; & nbsp; & nbsp; & nbsp;& nbsp; Underground powerhouse structure and local topographic and geological map < br / >
& nbsp;& nbsp;& nbsp;{[ 13]}
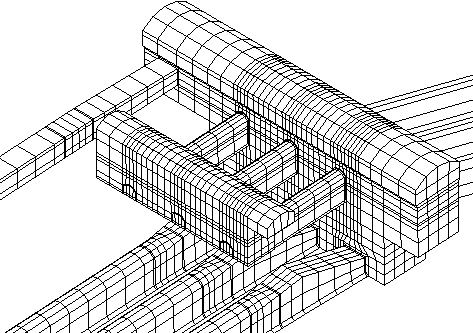
& nbsp; & nbsp; Three dimensional finite element grid diagram of cavern group structure & nbsp& nbsp; & nbsp; & nbsp; & nbsp; & nbsp; & nbsp; & nbsp; & nbsp; & nbsp; & nbsp; & nbsp; & nbsp; Partial grid diagram of weak structural plane fj2, fj5 and fj4 < br / >
The three-dimensional seepage field calculation program is automatically generated and compiled by FEPG, the seepage field during construction is preliminarily analyzed, and the dead (Live) node method for calculating the free surface of seepage field is proposed for the first time. The practice of this method shows that the calculation is simple and efficient. It is used to calculate the stable seepage field in the dam area under the normal pool level, considering the leakage of groundwater to karst pipeline, and good results are obtained< br />

& nbsp;& nbsp;& nbsp;& nbsp;& nbsp;& nbsp;& nbsp;& nbsp;< br />
A large-scale three-dimensional elastic-plastic finite element calculation program which can simulate the excavation, construction and support construction process of cavern group is automatically generated and compiled by FEPG, which is applied to the stability elastic-plastic analysis of the excavation and support process of cavern group of Suofengying underground powerhouse< br />

& nbsp;{[ 17]}
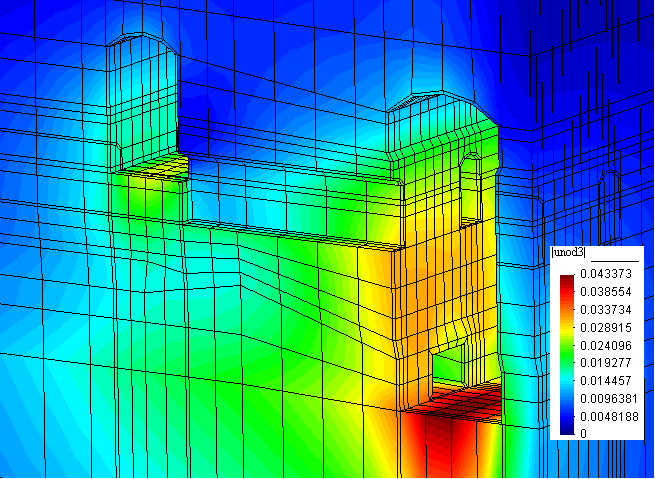
& nbsp; & nbsp; & nbsp; & nbsp; Schematic diagram of lining deformation after excavation & nbsp& nbsp; & nbsp; & nbsp; & nbsp; & nbsp; & nbsp; & nbsp; & nbsp; & nbsp; & nbsp; & nbsp; & nbsp; & nbsp; Schematic diagram of powerhouse deformation after excavation < br / >
& nbsp;& nbsp;& nbsp;{[ 19]}
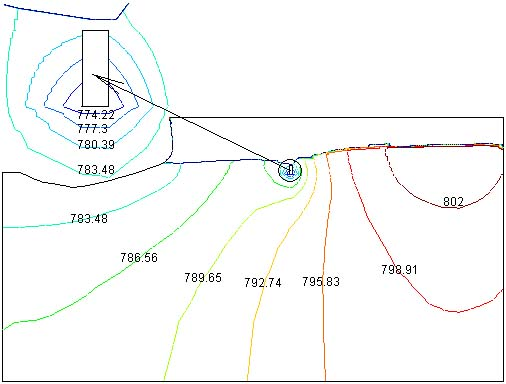
& nbsp; & nbsp; & nbsp; & nbsp; & nbsp; Moire diagram of powerhouse displacement after excavation & nbsp; Unit: M & nbsp& nbsp;& nbsp;& nbsp;& nbsp;& nbsp;& nbsp;& nbsp;& nbsp;& nbsp;& nbsp; & nbsp; & nbsp; & nbsp; & nbsp; & nbsp;& nbsp; Yield diagram of surrounding rock of powerhouse after excavation < br / >

 扫一扫,关注我们最新消息